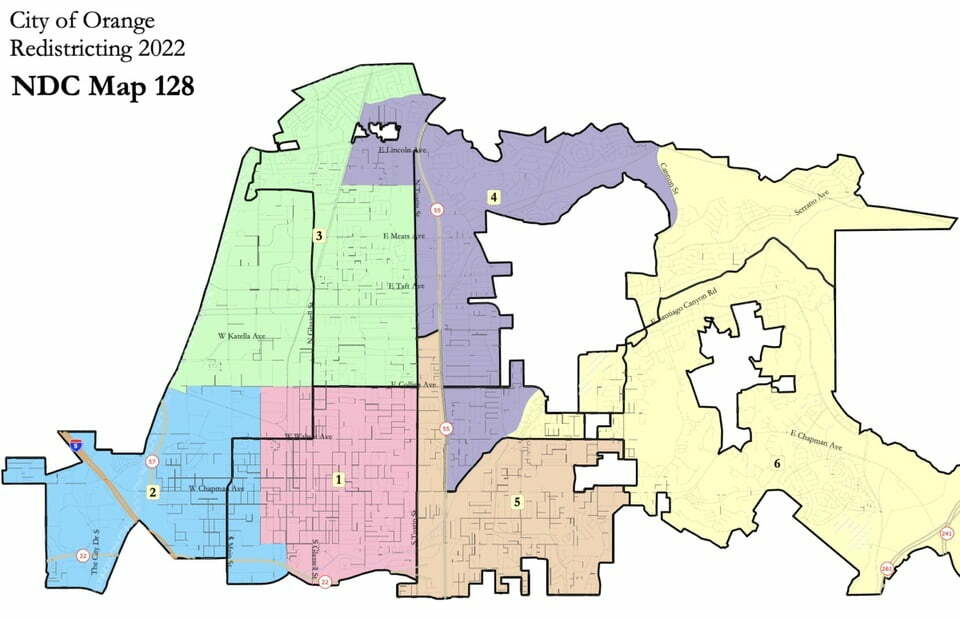
On March 22, 2022, the Orange City Council adopted a new City Council district map. Each voter resides within one of six districts, and participates in the election of one City Council member who must also reside in and be a registered voter of that district. All Orange residents vote for a Mayor of Orange.
Because Council terms are staggered so that the entire Council is not up for re-election at the same time, the districts will rotate through the election process as follows:
- Districts 1, 2, 3 and 5 will have Council Members elected at the General Municipal Election every four years in November and according to this schedule:
- 2020
- 2024
- 2028
- 2032
- Districts 4 and 6 will have Council Members elected at the General Municipal Election every four years in November and according to this schedule:
- 2022
- 2026
- 2030
- 2034
- The Mayor is an at-large seat, directly elected by voters from all districts at the General Municipal Election every two years in November and according to this schedule:
- 2020
- 2022
- 2024
- 2026
- 2028
- 2030
- 2032
What are by-district elections?
In by-district elections, the City is divided into Council districts. Each voter resides within one of those districts and participates in the election of one City Council member who must also reside in and be a registered voter of that district. State law permits cities to have district-based elections for council members and a separately elected mayor as an electoral system in compliance with the CVRA.
How Orange Moved to Districts
In 2019, an Orange resident sued the city for having an at-large system that dilutes the votes of Latinos, who made up nearly 40 percent of the city’s population at the time.
The resident based the lawsuit on the Federal Voting Rights Act (FVRA) that was adopted in 1965. Section 2 of the FVRA prohibits all voting practices or procedures that result in the denial or abridgement of the right of any citizen to vote on account of race, color, or membership in a language minority group. Upon finding a violation of the CVRA, the act requires courts to “implement appropriate remedies, including the imposition of district-based elections that are tailored to remedy the violation.”
Rather than challenging the lawsuit and opening the city up to costly litigation, the city reached a settlement with the Plaintiffs of the CVRA suit. The City agreed to move to by-district elections starting with the general election in November 2020, and that there would be six voting districts. The position of Mayor will remain a separately-elected office directly elected by the voters every two years.
The City of Orange will moved from a five person City Council- four directly elected at-large Council Members and a directly elected at-large Mayor- to a six person City Council with one directly elected at-large Mayor. The City’s six voting districts each elect one Council Member, with everyone voting for Mayor.
City of Orange By-District Demographics (Map 138)
| District | 1 | 2 | 3 | 4 | 5 | 6 | Total | |
|---|---|---|---|---|---|---|---|---|
| Ideal | Total Pop | 23,389 | 22,379 | 22,657 | 22,499 | 23,301 | 22,343 | 136,568 |
| 22,761 | Deviation from ideal | 628 | -382 | -104 | -262 | 540 | -418 | 1,010 |
| % Deviation | 2.76% | -1.68% | -0.46% | -1.15% | 2.37% | -1.84% | 4.60% | |
| Total Pop | % Hisp | 35% | 55% | 34% | 25% | 57% | 23% | 38% |
| % NH White | 55% | 26% | 52% | 55% | 33% | 60% | 47% | |
| % NH Black | 2% | 3% | 2% | 1% | 2% | 1% | 2% | |
| % Asian-American | 7% | 14% | 12% | 18% | 7% | 15% | 12% | |
| Citizen Voting Age Pop | Total | 18,838 | 13,983 | 16,277 | 15,190 | 11,651 | 16,310 | 92,250 |
| % Hisp | 24% | 40% | 26% | 16% | 36% | 19% | 26% | |
| % NH White | 66% | 41% | 61% | 62% | 54% | 63% | 59% | |
| % NH Black | 1% | 3% | 1% | 1% | 1% | 2% | 2% | |
| % Asian/Pac.Isl. | 8% | 15% | 12% | 20% | 8% | 15% | 13% | |
| Voter Registration (Nov 2016) | Total | 11,582 | 7,856 | 12,411 | 13,438 | 9,513 | 13,510 | 68,310 |
| % Latino est. | 27% | 40% | 25% | 14% | 32% | 19% | 25% | |
| % Spanish-Surnamed | 24% | 36% | 22% | 13% | 29% | 17% | 22% | |
| % Asian-Surnamed | 4% | 11% | 6% | 12% | 5% | 9% | 8% | |
| % Filipino-Surnamed | 1% | 2% | 2% | 1% | 1% | 1% | 1% | |
| % NH White est. | 66% | 43% | 65% | 70% | 59% | 69% | 64% | |
| % NH Black | 1% | 2% | 1% | 1% | 2% | 2% | 1% | |
| Voter Turnout (Nov 2016) | Total | 9,359 | 5,786 | 10,038 | 11,181 | 7,702 | 11,310 | 55,377 |
| % Latino est. | 25% | 38% | 24% | 14% | 30% | 18% | 23% | |
| % Spanish-Surnamed | 23% | 34% | 21% | 12% | 27% | 16% | 21% | |
| % Asian-Surnamed | 4% | 10% | 5% | 10% | 4% | 8% | 7% | |
| % Filipino-Surnamed | 1% | 2% | 1% | 1% | 1% | 1% | 1% | |
| % NH White est. | 68% | 45% | 67% | 72% | 61% | 71% | 66% | |
| % NH Black | 1% | 2% | 1% | 1% | 2% | 2% | 1% | |
| Voter Turnout (Nov 2014) | Total | 4,637 | 2,353 | 5,422 | 6,199 | 3,879 | 6,547 | 29,037 |
| % Latino est. | 17% | 26% | 14% | 9% | 19% | 12% | 14% | |
| % Spanish-Surnamed | 15% | 24% | 13% | 8% | 17% | 10% | 13% | |
| % Asian-Surnamed | 3% | 13% | 4% | 10% | 5% | 7% | 7% | |
| % Filipino-Surnamed | 1% | 1% | 1% | 1% | 1% | 1% | 1% | |
| % NH White est. | 78% | 57% | 77% | 78% | 73% | 79% | 75% | |
| % NH Black est. | 1% | 1% | 1% | 1% | 2% | 1% | 1% | |
| ACS Pop. Est. | Total | 24,528 | 23,872 | 24,512 | 21,272 | 23,444 | 21,874 | 139,502 |
| Age | age0-19 | 25% | 26% | 28% | 25% | 27% | 23% | 26% |
| age20-60 | 60% | 62% | 56% | 54% | 57% | 54% | 57% | |
| age60plus | 15% | 12% | 16% | 21% | 16% | 24% | 17% | |
| Immigration | immigrants | 21% | 30% | 19% | 27% | 27% | 21% | 24% |
| naturalized | 40% | 41% | 49% | 58% | 36% | 57% | 46% | |
| Language spoken at home | english | 61% | 44% | 66% | 61% | 55% | 69% | 59% |
| spanish | 32% | 42% | 23% | 22% | 37% | 18% | 29% | |
| asian-lang | 4% | 10% | 8% | 9% | 5% | 8% | 7% | |
| other lang | 3% | 4% | 3% | 8% | 3% | 5% | 4% | |
| Language Fluency | Speaks Eng. "Less than V | 16% | 23% | 12% | 15% | 21% | 10% | 16% |
| Education (among those age 25 | hs-grad | 52% | 50% | 55% | 43% | 50% | 47% | 49% |
| bachelor | 20% | 19% | 20% | 29% | 22% | 27% | 23% | |
| graduatedegree | 10% | 8% | 11% | 16% | 9% | 17% | 12% | |
| Child in Household | child-under18 | 26% | 31% | 35% | 35% | 34% | 30% | 32% |
| Pct of Pop. Age 16+ | employed | 63% | 55% | 61% | 62% | 64% | 61% | 61% |
| Household Income | income 0-25k | 17% | 18% | 12% | 9% | 12% | 9% | 13% |
| income 25-50k | 22% | 20% | 16% | 15% | 22% | 15% | 18% | |
| income 50-75k | 20% | 22% | 16% | 13% | 16% | 12% | 16% | |
| income 75-200k | 38% | 37% | 49% | 44% | 41% | 46% | 42% | |
| income 200k-plus | 3% | 3% | 7% | 19% | 10% | 18% | 10% | |
| Housing Stats | single family | 57% | 38% | 75% | 86% | 70% | 81% | 68% |
| multi-family | 43% | 62% | 25% | 14% | 30% | 19% | 32% | |
| rented | 62% | 71% | 39% | 24% | 40% | 23% | 43% | |
| owned | 38% | 29% | 61% | 76% | 60% | 77% | 57% |
Total population data from the 2010 Decennial Census.
Surname-based Voter Registration and Turnout data from the California Statewide Database.
Latino voter registration and turnout data are Spanish-surname counts adjusted using Census Population Department undercount estimates. NH White and NH Black registration and turnout counts estimated by NDC. Citizen Voting Age Pop., Age, Immigration, and other demographics from the 2012-2016 American Community Survey and Special Tabulation 5-year data.
About
The Orange City Council provides policy direction for the City of Orange and enacts all municipal legislation. Council members serve in a quasi-judicial role on certain administrative appeals and direct the administration of policy decisions through the City Manager, who delegates those policies to the appropriate City staff.